 Information about some projects by Marek Walczak, Martin Wattenberg, Rory Solomon, Wesley Heiss, Johanna Kindvall and others will now be documented at1 http://someprojects.info….
- test [↩]
Information about some projects by Marek Walczak, Martin Wattenberg, Rory Solomon, Wesley Heiss, Johanna Kindvall and others will now be documented at1 http://someprojects.info….
 [here][now] is an installation and Internet artwork that investigates the limits of patience and space in a multi-user virtual 3D environment. The project draws comparisons between technological progress and geographical exploration, implicitly hinting at an equivalence between forgotten geographies and outmoded technologies.
[here][now] will premier at the Incheon Digital Art Festival 2009 in Korea on August 7th 2009.
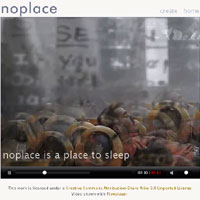 Noplace Online has launched as part of the Tate’s Intermedia series.
Whether paradise, heaven or a pessimistic distopia, each of us has a vision like no place on Earth. In noplace you write a few words about that place that has not yet come into being. As your write, your words trigger a set of visual associations, colliding to form a video of your ideal.
LAUNCH
 If you are in Amsterdam on Friday 19th October we invite you to the opening of Video Vortex at the Netherlands Media Art Institute
Where we will be showing our work:
Noplace : Heaven
You may enjoy some screengrabs of the piece.
 Whatever is in your clipboard, something that’s on your mind or just a distraction, you Paste. Paste keeps track of everyone’s ctrl-V, option-V or middle-button press – these routine actions combine into a single text stream.
Paste collects both trivial and profound thoughts creating a continuous scroll. The minutia of collective consciousness forms a shared narrative. A narrative that reflects personal and public history – from the horrors of war to a recipe for mashed potatoes.
 Many Eyes is a bet on the power of human visual intelligence to find patterns. Our goal is to “democratize” visualization and to enable a new social kind of data analysis.
All of us in CUE‘s Visual Communication Lab are passionate about the potential of data visualization to spark insight. It is that magical moment we live for: an unwieldy, unyielding data set is transformed into an image on the screen, and suddenly the user can perceive an unexpected pattern.
 Everyone who has lived in an apartment has a story to tell. Gothamberg is a place to read, interact and exchange stories of lives in apartment buildings. Together, these tales of sounds and smells, lobbies and bathrooms, laundry room gossip and unexpected favors form a single collective building, Gothamberg. Their experiences form the elliptical threads of inhabitation, a mnemonic quality expressing something of the shared nature of dwelling.
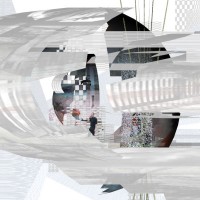
 Noplace is an interactive installation and website that aggregates utopias into a shared vision of paradise. We are developing software that collects data, images, and texts via the web and uses these feeds to create virtual architectural structures. These structures expand as utopias are added to the project. In the final installation, projected shadows on the gallery walls represent the architecture that’s evolved from the data, creating a physical browser which viewers can manipulate and transform with a wave of their hands.
Noplace has won a Creative Capital Award and is currently under development. More…
 Explore the sea of names, letter by letter…watch trends rise and fall, and dive in deeper to see your favorite name’s place in the historical tides.
The Baby Name Wizard’s NameVoyager is an interactive portrait of America’s name choices. Start with a “sea” of nearly 5000 names. Type a letter, and you’ll zoom in to focus on how that initial has been used over the past century. Then type a few more letters, or a name. Each stripe is a timeline of one name, its width reflecting the name’s changing popularity. If a name intrigues you, click on its stripe for a closer look.
 History flow is a tool for visualizing dynamic, evolving documents and the interactions of multiple collaborating authors. In its current implementation, history flow is being used to visualize the evolutionary history of wiki* pages on Wikipedia.
 Thinking Machine 4 explores the invisible, elusive nature of thought. Play chess against a transparent intelligence, its evolving thought process visible on the board before you.
The artwork is an artificial intelligence program, ready to play chess with the viewer. If the viewer confronts the program, the computer’s thought process is sketched on screen as it plays. A map is created from the traces of thousands of possible futures as the program tries to decide its best move. Those traces become a key to the invisible lines of force in the game as well as a window into the spirit of a thinking machine.
Installation, London ICA, 2003. Ars Electronica 2004. Launch
 What does music look like? The Shape of Song is an attempt to answer this seemingly paradoxical question. The custom software in this work draws musical patterns in the form of translucent arches, allowing viewers to see–literally–the shape of any composition available on the Web. The resulting images reflect the full range of musical forms, from the deep structure of Bach to the crystalline beauty of Philip Glass.
 Once at a family reunion we were talking about time. It turned out that everyone had mental images of time, but they were all different. For instance, I imagine time as a rug that I am making, close by its all strands and colors but from a distance the rug forms into patterns. My uncle saw it as a 3d spiral thing. We decided to do a piece that looks at how people imagine and navigate through time.
TimeMaker, a commission by Art Center Nabi, is a place where individuals can express their subjective thoughts and experiences about the abstract theme of time. It is a Clock Gallery where one can take a look at other people’s interpretations of time.
 From the beginning, net art has travelled multiple paths. More than a medium, the net is a environment uniquely hospitable to many diverse media: programming and animation, video and audio, gameplay and community. Each individual artist picks up these threads and weaves them in novel combinations. The Idea Line is designed to let you follow these threads of thought yourself, and discover how each work is part of a larger tapestry.
The Idea Line displays a timeline of net artworks, arranged in a fan of luminous threads. Each thread corresponds to a particular kind of artwork or type of technology. The brightness of each thread varies with the number of artworks that it contains in each year, so you can watch the ebb and flow of different lines of thought over time. Launch